
Custom Sales Visualizer Tools: Data Tells a Story, Data Supports Sales
Learn how a custom coded sales visualizer helps our clients tell their sales story
For the last 21+ years, Farotech has helped B2B organizations transform their marketing, improve their sales, and prove ROI on their marketing dollars. Part of that process is about communicating a compelling story about your brand that centers your client as the hero and you as the guide. This is especially true in the sales process.But without hard data to back up their claims, sales teams can be hamstrung, relying only on the power of how well they can tell a story. However, the key to successful selling isn’t working harder, but smarter and more efficiently. This is where collecting and analyzing data comes in. With that in mind, our goal is to help you tell a stronger story through sales visualization.
Three key things data can do for sales include:
- Data Can Segment Customers and Their Data
- Data Allows Companies to Adjust to Customers’ Needs
- Data Can Indicate What is or Isn’t Possible
About six years ago, we implemented our first sales visualizer tool to our sales approach and had phenomenal results. Because of those results, we started to implement these sales support tools with our clients who have also had great success with them.
Let’s walk through a sample. So my first question is, “What is your targeted sales goal for next year?” Let’s say your target revenue for next year is $20mil.
Then, I’d ask, “What is your current annual revenue?” Let’s say it’s $10mil
Then I’d move to projected revenue. “What is your projected revenue for this year?” Let’s say right now it’s $15mil.
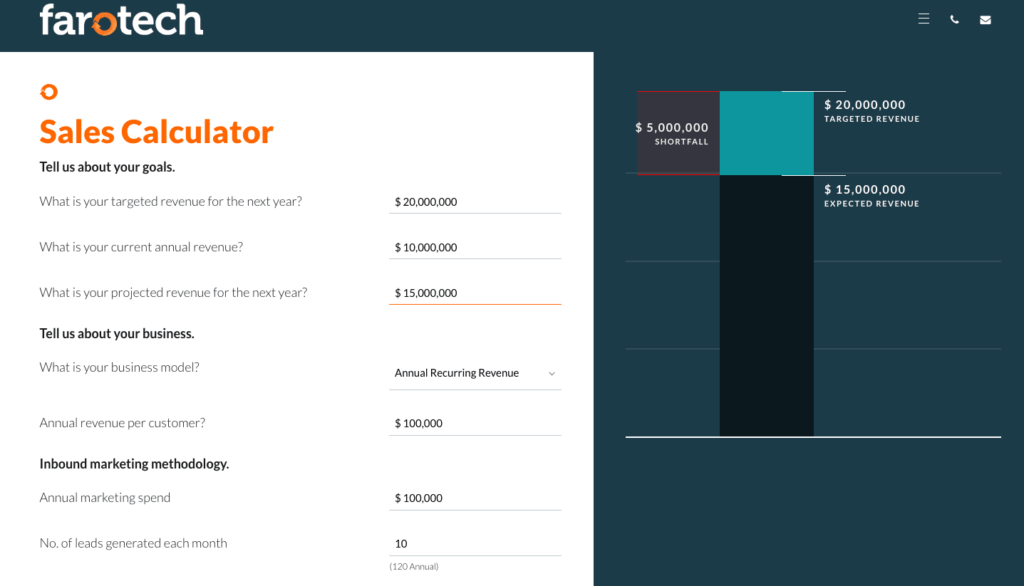
As you can see, the visualizer shows an annual shortfall of $5 mil.
Once I’ve gotten answers to those questions, the next thing I’ll ask is, “What is your business model? How do you bill? Is it Annual, monthly, or fixed? Let’s say they bill annually at 100K per client.
For our inbound methodology, if you were to spend 100K on digital marketing with us, and that got you 10 leads per month, and you were to close 50% of those leads…
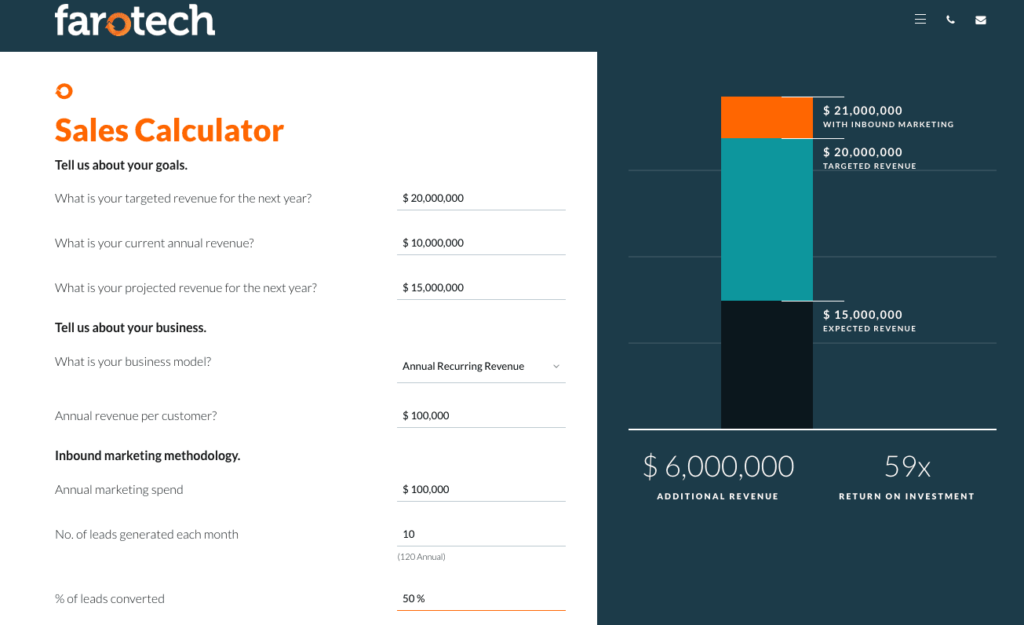
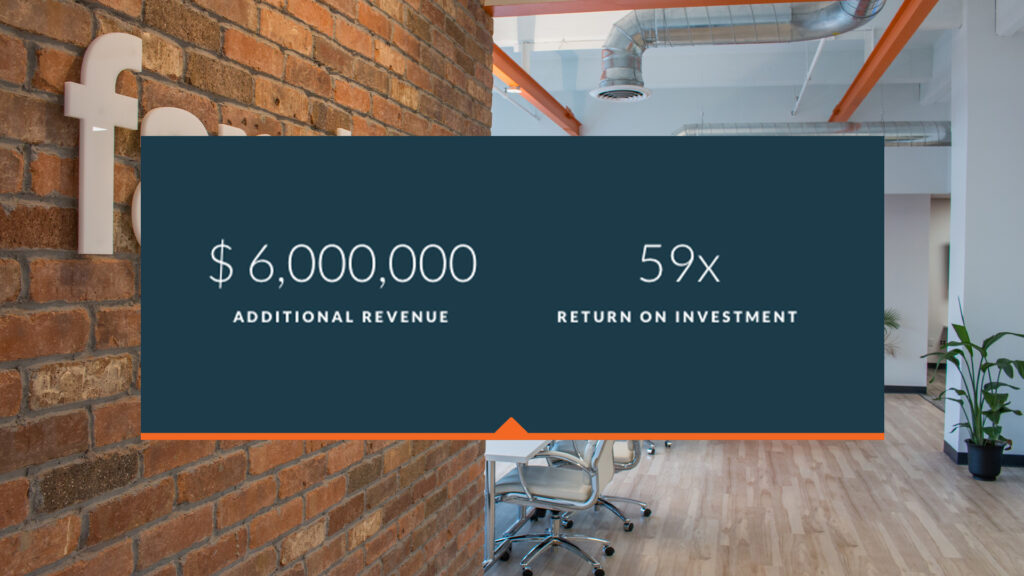
You’ll notice that the visualizer removes the shortfall and now you have revenue in the positive. With the help of digital marketing, you’re now $1 mil over your goal and that, if you’ll notice here on the bottom right, would equate to $6mil in annual revenue increase which is 59x the annual ROI.
If you like what you see here, please fill out the form below, and we will give you an estimate for a visualizer that fits your approach. You’ll be surprised that these tools are very affordable, and we have interest-free financing plans for development.
Usually, when we demonstrate this to potential clients, our team will go through these questions one by one. You’ll want to ask the following questions:
- “What is your targeted sales goal for next year?”
- “What is your current annual revenue?”
- “What is your projected revenue for this year?”
- “What is your business model? How do you bill? Is it annual, monthly, or fixed?”
Then we would ask clients some harder questions such as:
- What are the stakes if you miss your sales goal?
- Do you think you can do this without outside support
- How much would your company be willing to invest in order to reach your goals?
Based on these numbers, the sales visualizer will calculate any shortfalls and revenues against your sales goal.
Keep in mind that the numbers in the above video are just estimates designed to show you how a sales visualizer would work in real-time.
Every business is unique.
Every sales process is unique.
Depending on your sales process, you may need a time efficiency calculator or cost savings calculator. Whichever sales support tool fits your needs.
What’s really great is that you can integrate this data with your CRM, Hubspot, Salesforce, or any other platform with a decent API.
Your custom-coded sales tool can be developed as self-service (clients can use it in their own time) or as a walkthrough tool with a sales rep during your sales process. The functionality also enables you to create a shareable link or to save your sales visualizer to your desktop or mobile device.
You already have a great sales story––our goal is to help you tell it better through visualization.
If you like what you see here and want to develop a custom-coded sales tool of your own, please fill out the form below, and we will give you an estimate for a visualizer that fits your approach. You’ll be surprised that these tools are very affordable, and we have interest-free financing plans for development.
You can also reach out to us at [email protected]