
Measuring Website Success: Essential Website Analytics for Manufacturers
The website experts at Farotech specialize in essential website analytics for manufacturers. Learn how to make your website succeed.
Measuring Website Success: Essential Website Analytics for Manufacturers
People who say “don’t sweat the small stuff” shouldn’t be in marketing. In the manufacturing industry, the smallest details uncovered through website analytics for manufacturers can often make the difference between success and failure in marketing.
By paying close attention to the data, we can identify key insights and opportunities that might otherwise be missed and make informed data-driven decisions to optimize your strategy and drive results.
Understanding web analytics in manufacturing is essential for any business that wants to make data-driven decisions and stay competitive.
However, many manufacturing companies fail to make data-driven decisions in marketing. Marketers never set out to make this mistake. But the painful reality is that they get caught up in something we call RAM. RAM means Random Acts of Marketing.
Random Acts of Marketing (RAM) can occur when companies pursue disconnected marketing ideas (sometimes great ones) without a clear cohesive strategy backed by analytics. Without analytics for websites as the driver, marketing efforts can become fragmented and fail to deliver optimal results
Data suggests that manufacturers who use a data-driven marketing approach have drastically better results. In fact, according to Forbes, companies that use analytics of their websites are 5X more likely to make faster decisions than their competitors.
Web analytics provides insights into user behavior, preferences, and needs, helping manufacturers tailor their marketing efforts to meet customer needs.
Manufacturers who use website analytics tools can improve their ROI by identifying effective marketing channels and campaigns and reallocating resources accordingly.
In summary, web analytics is crucial for manufacturers who want to make data-driven decisions and achieve better results.
What Marketing Analytics Software is Best?
While there are numerous analytics software providers available, we’ve found that combining Google Analytics and HubSpot generates the most impactful insights for data-driven decisions.
Here are some quick benefits of the top analytics tools:
Google Analytics:
- Features: Real-time insight, real-time data and reporting, audience demographics, and custom dimensions
- Benefits: Comprehensive data tracking, free to use, and widely supported
HubSpot:
- Features: Contact attribution, campaign performance, and closed-loop analytics
- Benefits: All-in-one marketing platform, personalized reporting, and seamless CRM integration
And the power of using them both together? Combining Google Analytics and Hubspot can provide a more comprehensive view of your marketing performance, allowing for better decision-making and resource allocation.
Having reached this conclusion, the next step is to establish our goals and KPIs
Website Analytics for Manufacturers: Unpacking KPIs & Data Points
Understanding the difference between goals and KPIs is crucial to the success of any project or initiative. Before we dive in, let’s take a moment to clarify these terms.
While goals are the overarching objectives that we hope to achieve, KPIs (Key Performance Indicators) are the measurable metrics used to track progress toward those goals.
By defining and aligning our goals and KPIs, manufacturers can stay on track and ensure that we are making progress toward our desired outcomes.
What are the critical KPI data points you should be looking for?
If you’re just starting out with website analytics, we tell manufacturers it’s best to keep it simple. Trying to track too many KPIs can lead to ‘death by data’ and overwhelm.
Instead, we recommend focusing on a few basic KPIs until you see traction and then gradually expanding to more advanced metrics. This approach allows you to stay focused on what’s important, while also gaining valuable insights to inform your decision-making.
Key performance indicators (KPIs) (Quick List):
- Website Traffic
- Conversion Rates,
- Channel Performance
- New vs. Returning Visitors
How often should you check your goals and KPIs?
Before delving into analytics for your website, it’s crucial to differentiate between short-term and long-term goals and KPIs. Understanding the distinction between these two types of metrics will help you develop a data-driven strategy that aligns with your desired outcomes. By identifying which KPIs have short-term versus long-term impacts, you can prioritize your efforts and make informed decisions to achieve your goals.
Regularly monitoring your analytics is crucial. Consider setting up weekly or monthly reviews of your data and advanced data analysis.
Understanding Your Short-Term & Long-Term KPIs
When evaluating the success of any website analytics for manufacturers, it’s important to understand the distinction between short-term and long-term KPIs. Knowing what they are and the difference between them can provide valuable insights into the immediate performance and future growth of an organization. So let’s take a look at a list of the key KPIs for each.
Short-Term KPIs:
- Sessions: The number of times users are active on your website within a specific time period.
- Bounce Rate: The percentage of visitors who leave your website after viewing only one page.
- Pageviews: The total number of pages viewed by users on your website.
- Click-Through Rate (CTR): The percentage of users who click on a link or ad, out of the total number of users who saw it.
- Conversion Rate: The percentage of users who complete a specific action on your website, such as making a purchase or filling out a form.
- Cost per Click (CPC): The average cost of a click on a paid search ad.
- Cost per Acquisition (CPA): The average cost of acquiring a new customer.
- Return on Ad Spend (ROAS): The amount of revenue generated for every dollar spent on advertising.
- Time on Page: The average amount of time users spend on a specific page of your website.
- Exit Rate: The percentage of users who leave your website from a specific page.
Long-Term KPIs:
- Customer Lifetime Value (CLV): The total revenue a customer is expected to generate throughout their relationship with your business.
- Net Promoter Score (NPS): A measurement of customer loyalty and satisfaction.
- Churn Rate: The percentage of customers who stop using your product or service within a specific time period.
- Customer Retention Rate: The percentage of customers who continue to use your product or service over time.
- Market Share: The percentage of total sales in your industry that your business generates.
- Brand Awareness: The level of familiarity and recognition that customers have with your brand.
- Customer Satisfaction Rate: The percentage of customers who report being satisfied with your product or service.
- Average Order Value (AOV): The average amount spent per order on your website.
- Revenue Growth Rate: The percentage increase or decrease in revenue over a specific time period.
- Profit Margin: The percentage of revenue that remains after all expenses have been deducted.
For more information on how Farotech assists clients with analytics and reporting, please review this section of our Digital Marketing Unique Process.
Getting Help with Website Analytics for Manufacturers
Analytics can be difficult, and certifications can be time-consuming. It’s essential to seek help if you’re unsure about managing your manufacturing analytics effectively.
The benefits of using a digital marketing agency as your partner for your analytics are numerous, but here are just the top four reasons.
What to expect from an analytics partner:
- Expertise in how to identify critical goals & KPIs
- Regular Reporting
- Data-driven recommendations & analysis
- Connection to Automation and Analytics tools
Identifying a good partner vs. a bad partner
Choosing the right analytics partner can make a monumental difference. A bad partner may feel like just another vendor, providing reports with little guidance or support, while a great partner is invested in your success and feels like an extension of your team, constantly seeking out opportunities to make a meaningful impact.
Here are 5 things you should look for in a great analytics partner:
- Expertise: Your partner should have extensive experience and expertise in analytics, with a track record of success in helping businesses like yours achieve their goals.
- Proactivity: A great partner should take a proactive approach to analyzing your data, constantly seeking out opportunities for improvement and optimization.
- Communication: Strong communication skills are crucial in an analytics partner, as they should be able to clearly explain complex data and insights in a way that’s easy to understand.
- Customization: Every business is unique, so a great partner should be able to provide customized analytics solutions tailored to your specific needs and goals.
- Partnership: Your analytics partner should be invested in your success and feel like an extension of your team, offering guidance and support to help you achieve your objectives.
What does it look like to work with an analytics partner?
As part of our work with manufacturing clients, we provide them with real-time access to website analytics for manufacturers through HubSpot. This includes a dashboard that concisely reviews the critical information that every company needs to know.
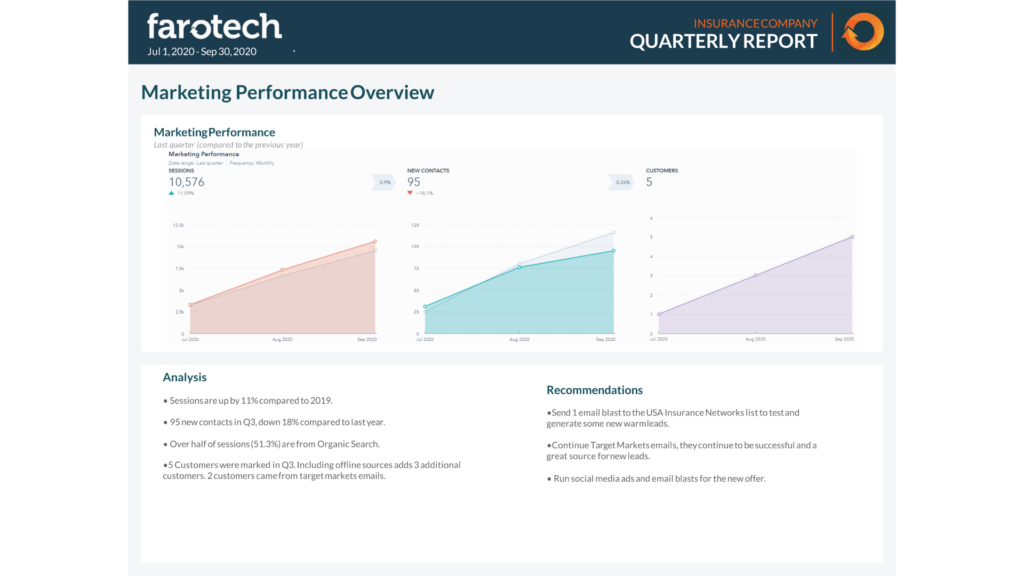
For example, in the monthly view, we track the following:
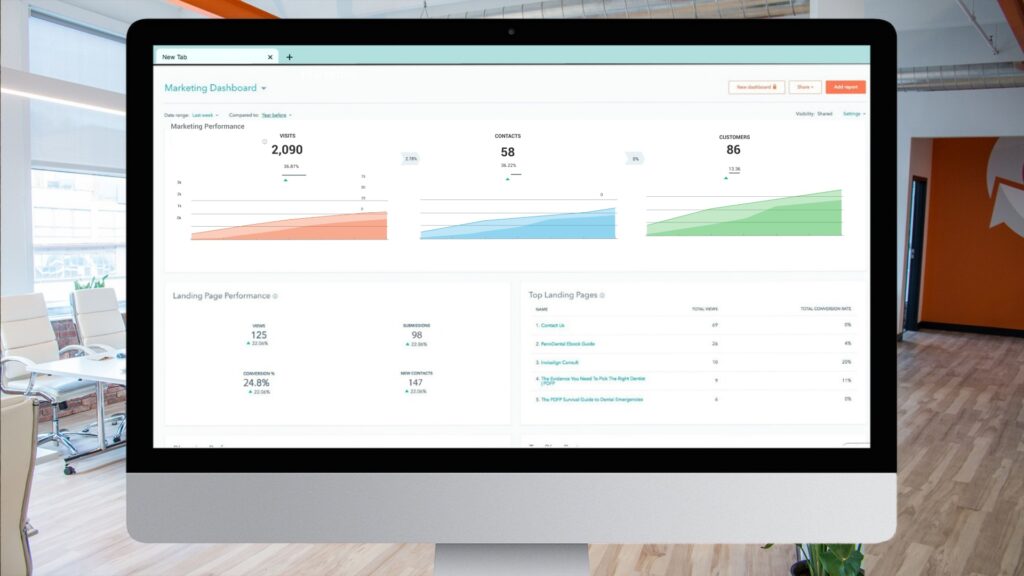
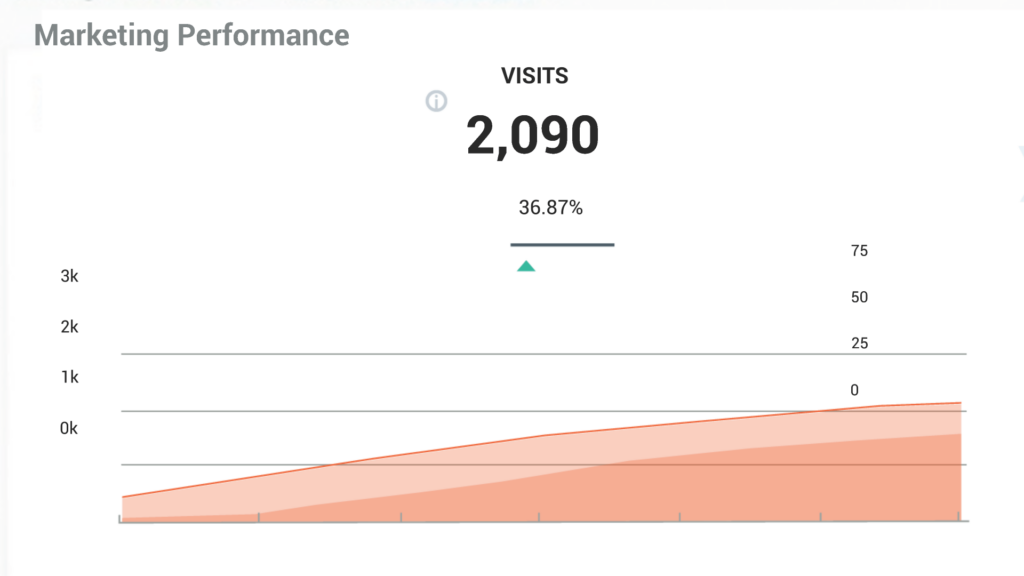
How much traffic did you get compared to your goals:
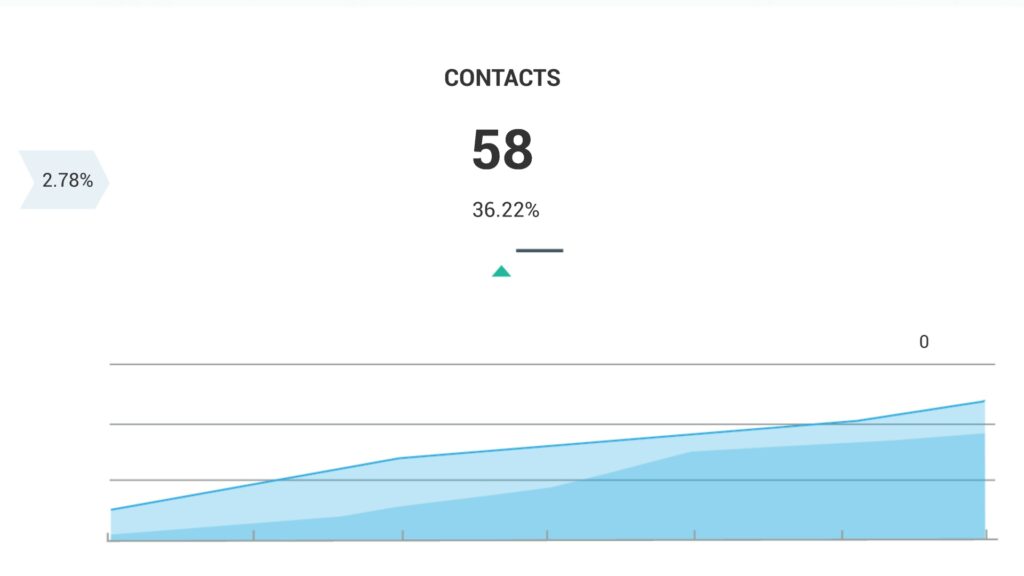
How many leads did you get compared to your goals:
How many clients did you close compared to your goals:
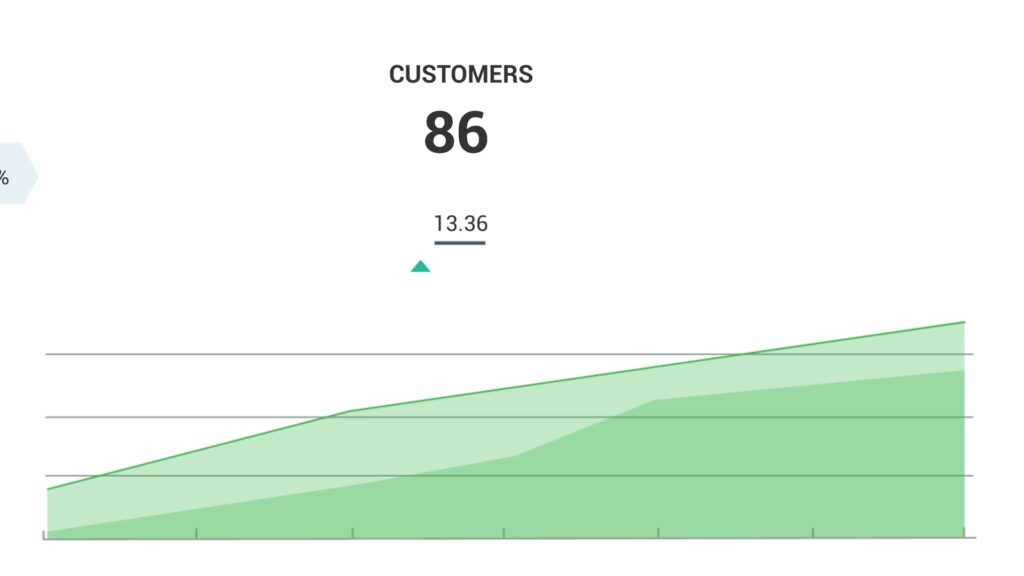
Once we know all of that, we want to try to understand where our leads come from and how can we quantify it.
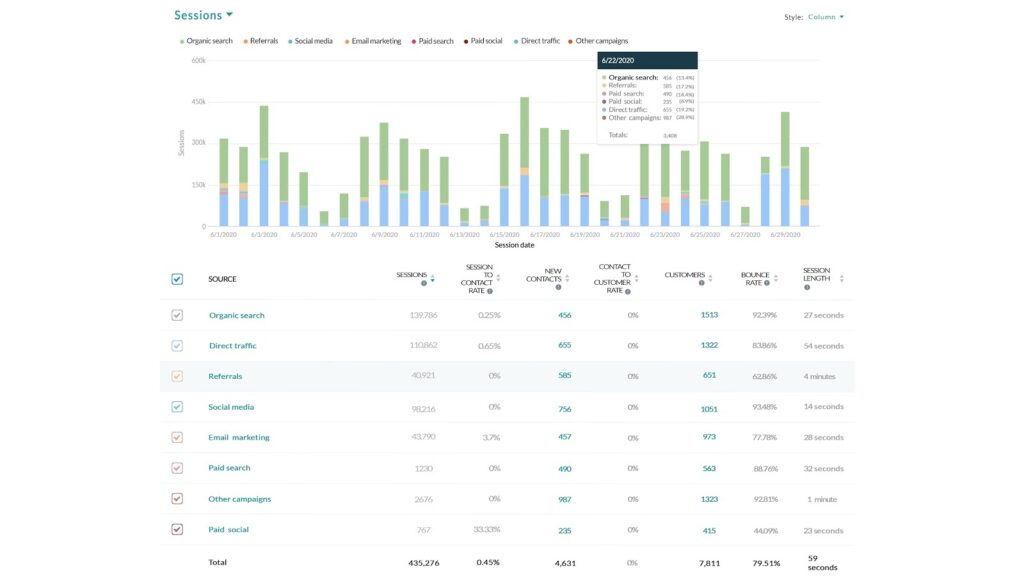
For example, on this screen, we are able to see:
Where did our leads come from in terms of:
- Organic Search
- Direct Traffic
- Referrals
- Social Media
- Email Marketing
- Paid Search
- Other Campaigns
- Paid Social
Next, you can assess the effectiveness of each channel by reviewing the following filters:
- Sessions
- Session to Contact Rate
- New Contacts
- Contacting Customer Rate
- Customers
- Bounce Rate
- Session Length
When you partner with our team, we provide a comprehensive view of your advanced analytics by combining monthly and quarterly deep dive reports with real-time HubSpot data.
This level of transparency is essential for making data-driven and faster decisions which enables us to:
- Double down on what’s working
- Improve what needs attention
- And abandon good ideas that aren’t delivering the desired results
By taking this approach, we can optimize your marketing strategy and drive meaningful results for your manufacturing company.
Examples of Website Analytics reports
Our company offers these analytics reports to keep you updated on your progress.
Additionally, we provide a quarterly deep dive report that you can review with our account manager and project managers for a more comprehensive analysis. For real-time access to all of your analytics, we use HubSpot to ensure that you have the most current data available.
The Bottom Line
If your organization is not using analytics effectively, chances are you are flying blind. It’s essential to leverage the power of analytics and predictive analytics to make data-driven decisions and keep your competitive advantage.
If you feel stuck, consider using a digital marketing agency like Farotech to help you navigate the complexities of your analytics. This will allow you to focus on your core business operations while improving your marketing strategies.
Please reach out to us; we would love to walk you through a quick demo of how we help manufacturers like yours transform their marketing and sales.
If you’re in the early stages of researching, I recommend our guide: The Comprehensive Guide to Digital Marketing.